Calculating the rate of a reaction from a curve
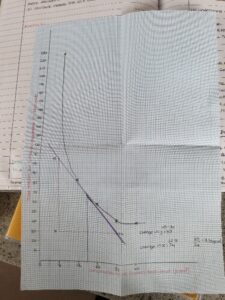
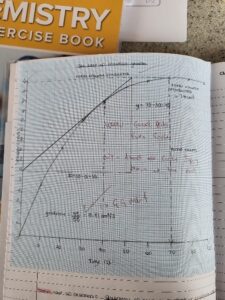
Year 11 students have been continuing their GCSE course this year. They have been looking at the rate of a reaction and the many factors than can affect these reactions. As part of this unit, there are many numeracy skills that can be assessed on the exam. Students need to be able to draw graphs with smooth curves of best fit, describe these graphs using the correct terminology or even explain why the curve has the shape it does. Another aspect of this topic is using the graphs to calculate the rate of reaction at a specific time. Normally, the gradient of the line would be adequate, however, as these graphs are curves, they have an ever changing gradient. To overcome this, the students have to be able to draw a tangent on their curves (a straight line that just touches the curve at the desired time or volume). They can then use a formula to calculate the gradient of this tangent. Lots of students struggle with this as it can be an alien and abstract concept that they haven’t come across before. The use of the visualizer and modelling are a great tool in explaining how to draw these and walking through the calculations. Below are some examples of the current year 11 work. They have worked really hard and shown great resilience in overcoming this challenge. Well done, Year 11!
Mr Dean
Science Department